One of my peers gave me some valid feedback. However, I don't see any way to answer the question. The scale is based on the low and high price of all the valid sales.
For MM valid sales are first filtered by the Guild and Account filter, then outliers are removed if the option is enabled.
A basic example is prices = { 1, 300, 200, 150, 340 }
Like Example #1 that basic example the lowest price is 1 and the highest price is 340. Each dot is drawn with one scale. The graph cannot be drawn where only certain dots are drawn at one scale and others with a different scale. That wouldn't work in the real world with a scatter plot. I wouldn't know how to do this on a TI-80 but I doubt it can use two different scales and if it did then the largest scale would push all the other dots down just like in game. The desired outcome of the OP is not achievable.
In a real world scenario scientists would remove the outliers and then examine the data. If the outliers were not longer skewing the data then they could explain the outliers and the results. If the outliers were removed and the data still did not make sense then the scientists would explain what may have went wrong with the experiment. Then try again. That isn't applicable here. You can't do weird math and customize that math to each item in game to produce pretty graphs.
You can't make dots conform to personal preferences. You can only get the low and high prices, the day range, and then calculate the coordinates for each dot.
I will show what it looks like to Intentionally skew the graph with the following examples.
Example #21 - Before Skewing Prices Added
Example #22 - After Skewing Prices Added
Originally Posted by Baertram

Please all stay focused on the details, read the explanations and if something is not working as expected provide an example, so one can rebuild it.
|
Originally Posted by Lucinator
So again, the difference between ATT and MM has been that MM seems to for whatever reason been having trouble scaling the Y part of the graph. So again, is there a way to change that manually.
|
Both ATT and MM handle scaling the Y part of the graph exactly the same and no equation or setting of any kind can alter the scale if the sales points are included on the graph. This is because the sales points eventually define the highest and lowest sale value. In example #21 the high price was 250, in Example #22 it is 2500.
Which is why in the before picture you see 12 dots with different Y coordinates, and the after picture with the sales of 500, 1000, 1200, 1500, 2000, 2500 all pushing the sales down to the bottom because the highest price is now 2500.
This is what is happening with the OPs initial screenshot Example #1 with the low price of 1 and the high price of 340.
Only MM has features to resolve the issue.
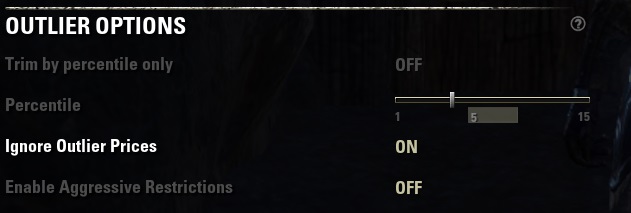
For this example trimming by the outer percentile did not eliminate the outliers very well because there are only a few sales and even at 15% which is 15% - 85% it wasn't enough. The standard method of trimming outliers wasn't sufficient for this example either but it may be for most cases. I was able to get the graph back to having a high price of 250 enabling Aggressive Restrictions.
The sales data is different for each item. No outlier routine will accommodate all items in all cases. Some of the intentional price skewing happens over time and the skewed prices are now part of the standard devation so they are included in the mean.
The other way to accomplish this if you don't want to trim outliers is to add the seller to the Guild and account filter and that will produce the results shown in Example #23 below.
Example #23